Weaving a Celestial Veil: Rendering Peter de Jong Attractors in Python
2026/8/7
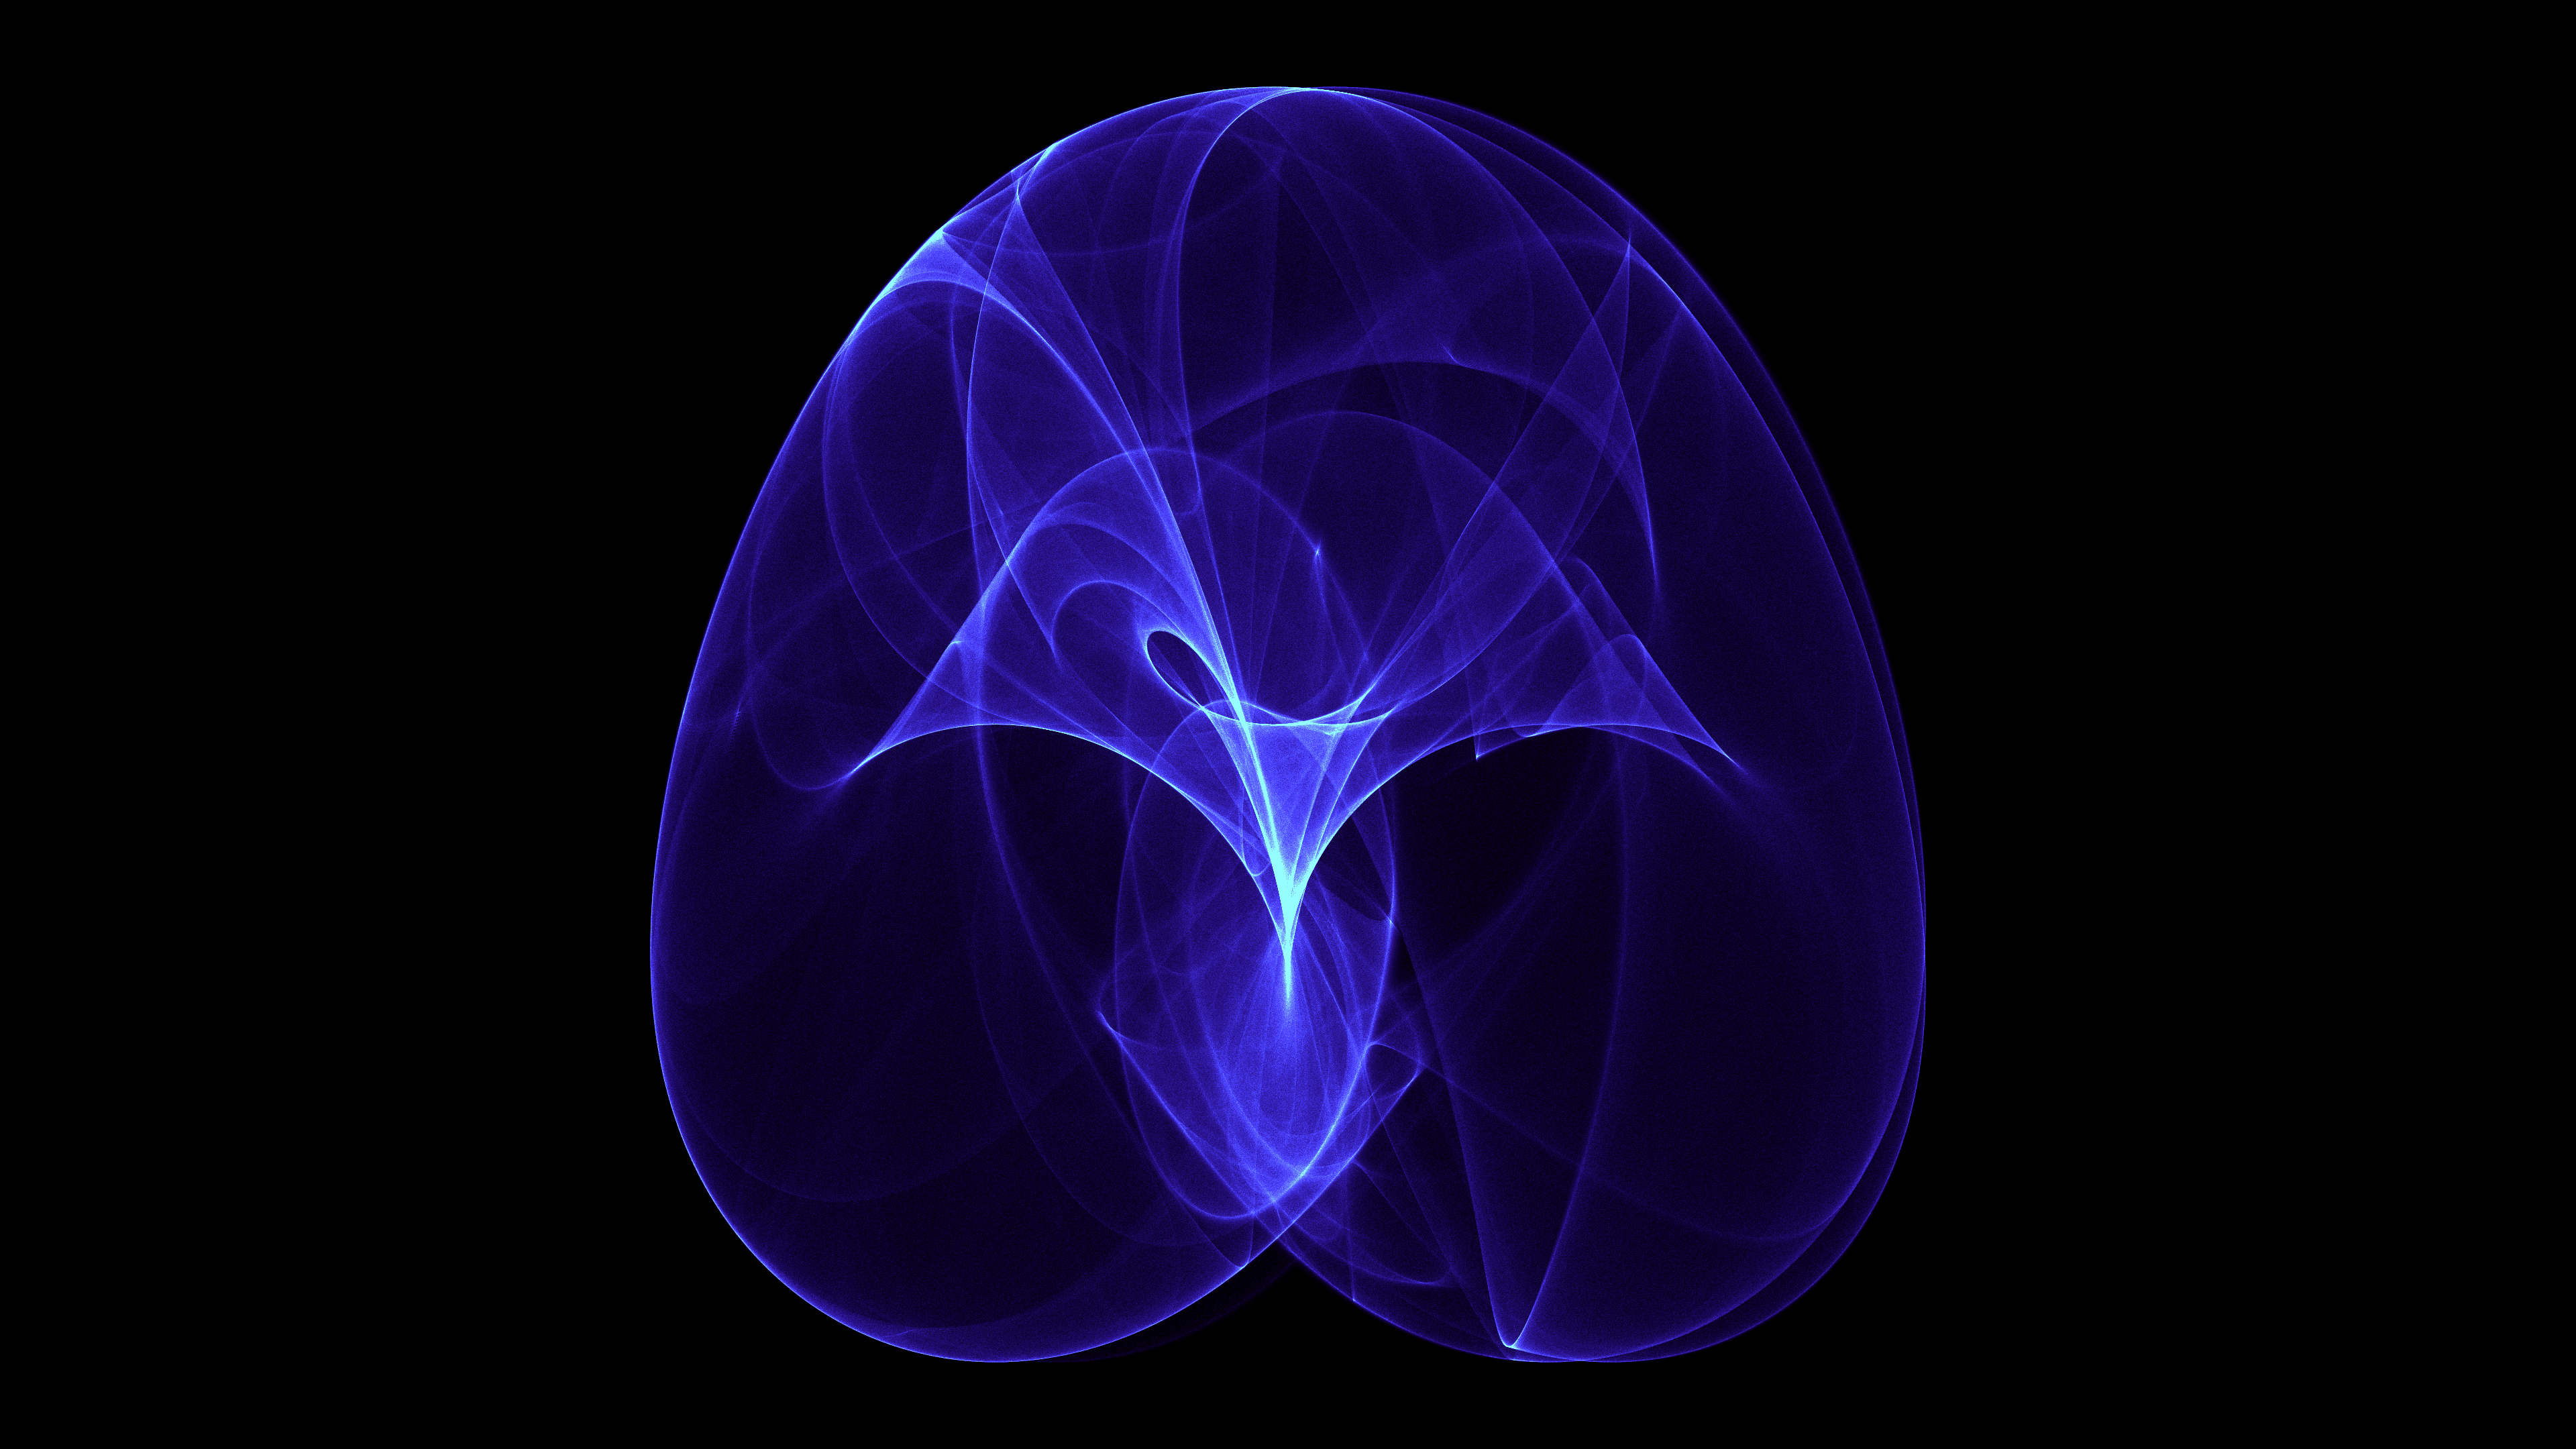
Generative art thrives on the delicate balance between chaos and order. Strange attractors are mathematical systems that perfectly encapsulate this balance: they are completely deterministic, yet practically unpredictable. The Peter de Jong attractor is a classic example. Depending on four simple parameters, it can generate shapes that look like rigid geometric lattices, swirling chaotic clouds, or delicate, folding veils of fabric."Celestial de Jong Veil 2D" explores the softer, more ethereal side of this mathematical equation. Instead of drawing distinct points or hard lines, the system accumulates millions of microscopic "hits" over time, generating a wispy, glowing nebula that slowly morphs as its mathematical parameters shift.Using Python, NumPy, and Py5, we can compute and render these complex density maps in real-time, offering a window into the continuous flow of chaotic systems.
Visual & Aesthetic Approach
The visual approach for this piece mimics astrophotography. When astronomers photograph deep space objects, they don't capture single distinct structures; instead, they capture the accumulation of photons on a sensor over long exposure times.We replicate this "long exposure" aesthetic by treating our 2D canvas as a high dynamic range density map. Rather than rendering individual points, every time the equation lands on a specific pixel, that pixel's density value increases. Over time, distinct, wispy structures emerge where the attractor is most dense, while the sparser areas fade into a dark background.To colorize the density map, the raw accumulated values are pushed through an exponential curve and mapped to a custom color gradient. Low-density areas glow with deep, celestial blues, while areas of intense mathematical focus burn bright cyan and white. The result is a smooth, nebulous texture that looks like glowing interstellar gas.Code & Technical Breakdown
The core of the Peter de Jong attractor is surprisingly simple. It is an iterative equation where the next (x, y) coordinate is calculated based on the sine and cosine of the current (x, y) coordinate, modified by four parameters (a, b, c, d).nx = np.sin(a * y) - np.cos(b * x)
ny = np.sin(c * x) - np.cos(d * y)To animate the structure, these four parameters are tied to slow-moving sine waves based on the frame count, causing the veil to continuously warp and fold over itself.However, rendering an attractor smoothly requires an immense amount of data. If you plot only a few thousand points, the result looks like static noise. To achieve the smooth veil effect, we need millions of iterations per frame. Python for loops are too slow for this, so we rely on NumPy's vectorized operations.In every frame, we start with 300,000 random coordinate pairs. We then iterate the Peter de Jong equation 15 times across the entire array simultaneously.
density_map *= 0.85
for _ in range(iters):
nx = np.sin(a * y) - np.cos(b * x)
ny = np.sin(c * x) - np.cos(d * y)
x, y = nx, ny
px = (cx + x * scale).astype(np.int32)
py_c = (cy + y * scale).astype(np.int32)
valid = (px >= 0) & (px < py5.width) & (py_c >= 0) & (py_c < py5.height)
px_v = px[valid]
py_v = py_c[valid]
np.add.at(density_map, (py_v, px_v), 1.0)Instead of clearing the screen every frame, we multiply the existing density_map by 0.85. This creates a fading trail, ensuring that as the attractor morphs, it leaves behind a ghostly echo of its previous shape.The np.add.at function is the secret to high-speed density rendering in Python. It efficiently tallies up the number of times our 300,000 coordinates land on any specific pixel in the grid.Once the density map is updated, it must be converted into visible colors and pushed to the screen.
c_val = np.clip(density_map, 0, 100) / 100.0
c_val = np.power(c_val, 0.7)

r = (c_val * 150).astype(np.uint8)
g = (c_val * c_val * 255).astype(np.uint8)
b = (np.clip(c_val * 2.0, 0, 1) * 255).astype(np.uint8)
alpha = np.full_like(r, 255)

color_arr = np.dstack((alpha, r, g, b))
py5.np_pixels[:, :, :] = color_arr
By shaping the raw density values with an exponent (c_val ** 0.7), we boost the faint, wispy edges of the nebula while preventing the dense core from washing out completely into white. This raw NumPy array is then written directly into Py5's pixel buffer, bypassing the standard shape-drawing pipeline for maximum performance.
Conclusion
"Celestial de Jong Veil 2D" highlights the immense power of density mapping in generative art. By treating the canvas not as a place to draw lines, but as a sensor that accumulates mathematical data, we can uncover the smooth, continuous forms hidden within chaotic equations. It’s a technique that turns cold arithmetic into sweeping, celestial beauty.GitHub: https://github.com/asamiile/py5-media-art/tree/main/sketch/celestial_de_jong_veil_2d
Purchase assets: Adobe Stock