Building an Isometric Cybernetic Circuit Board in py5
2026/8/29
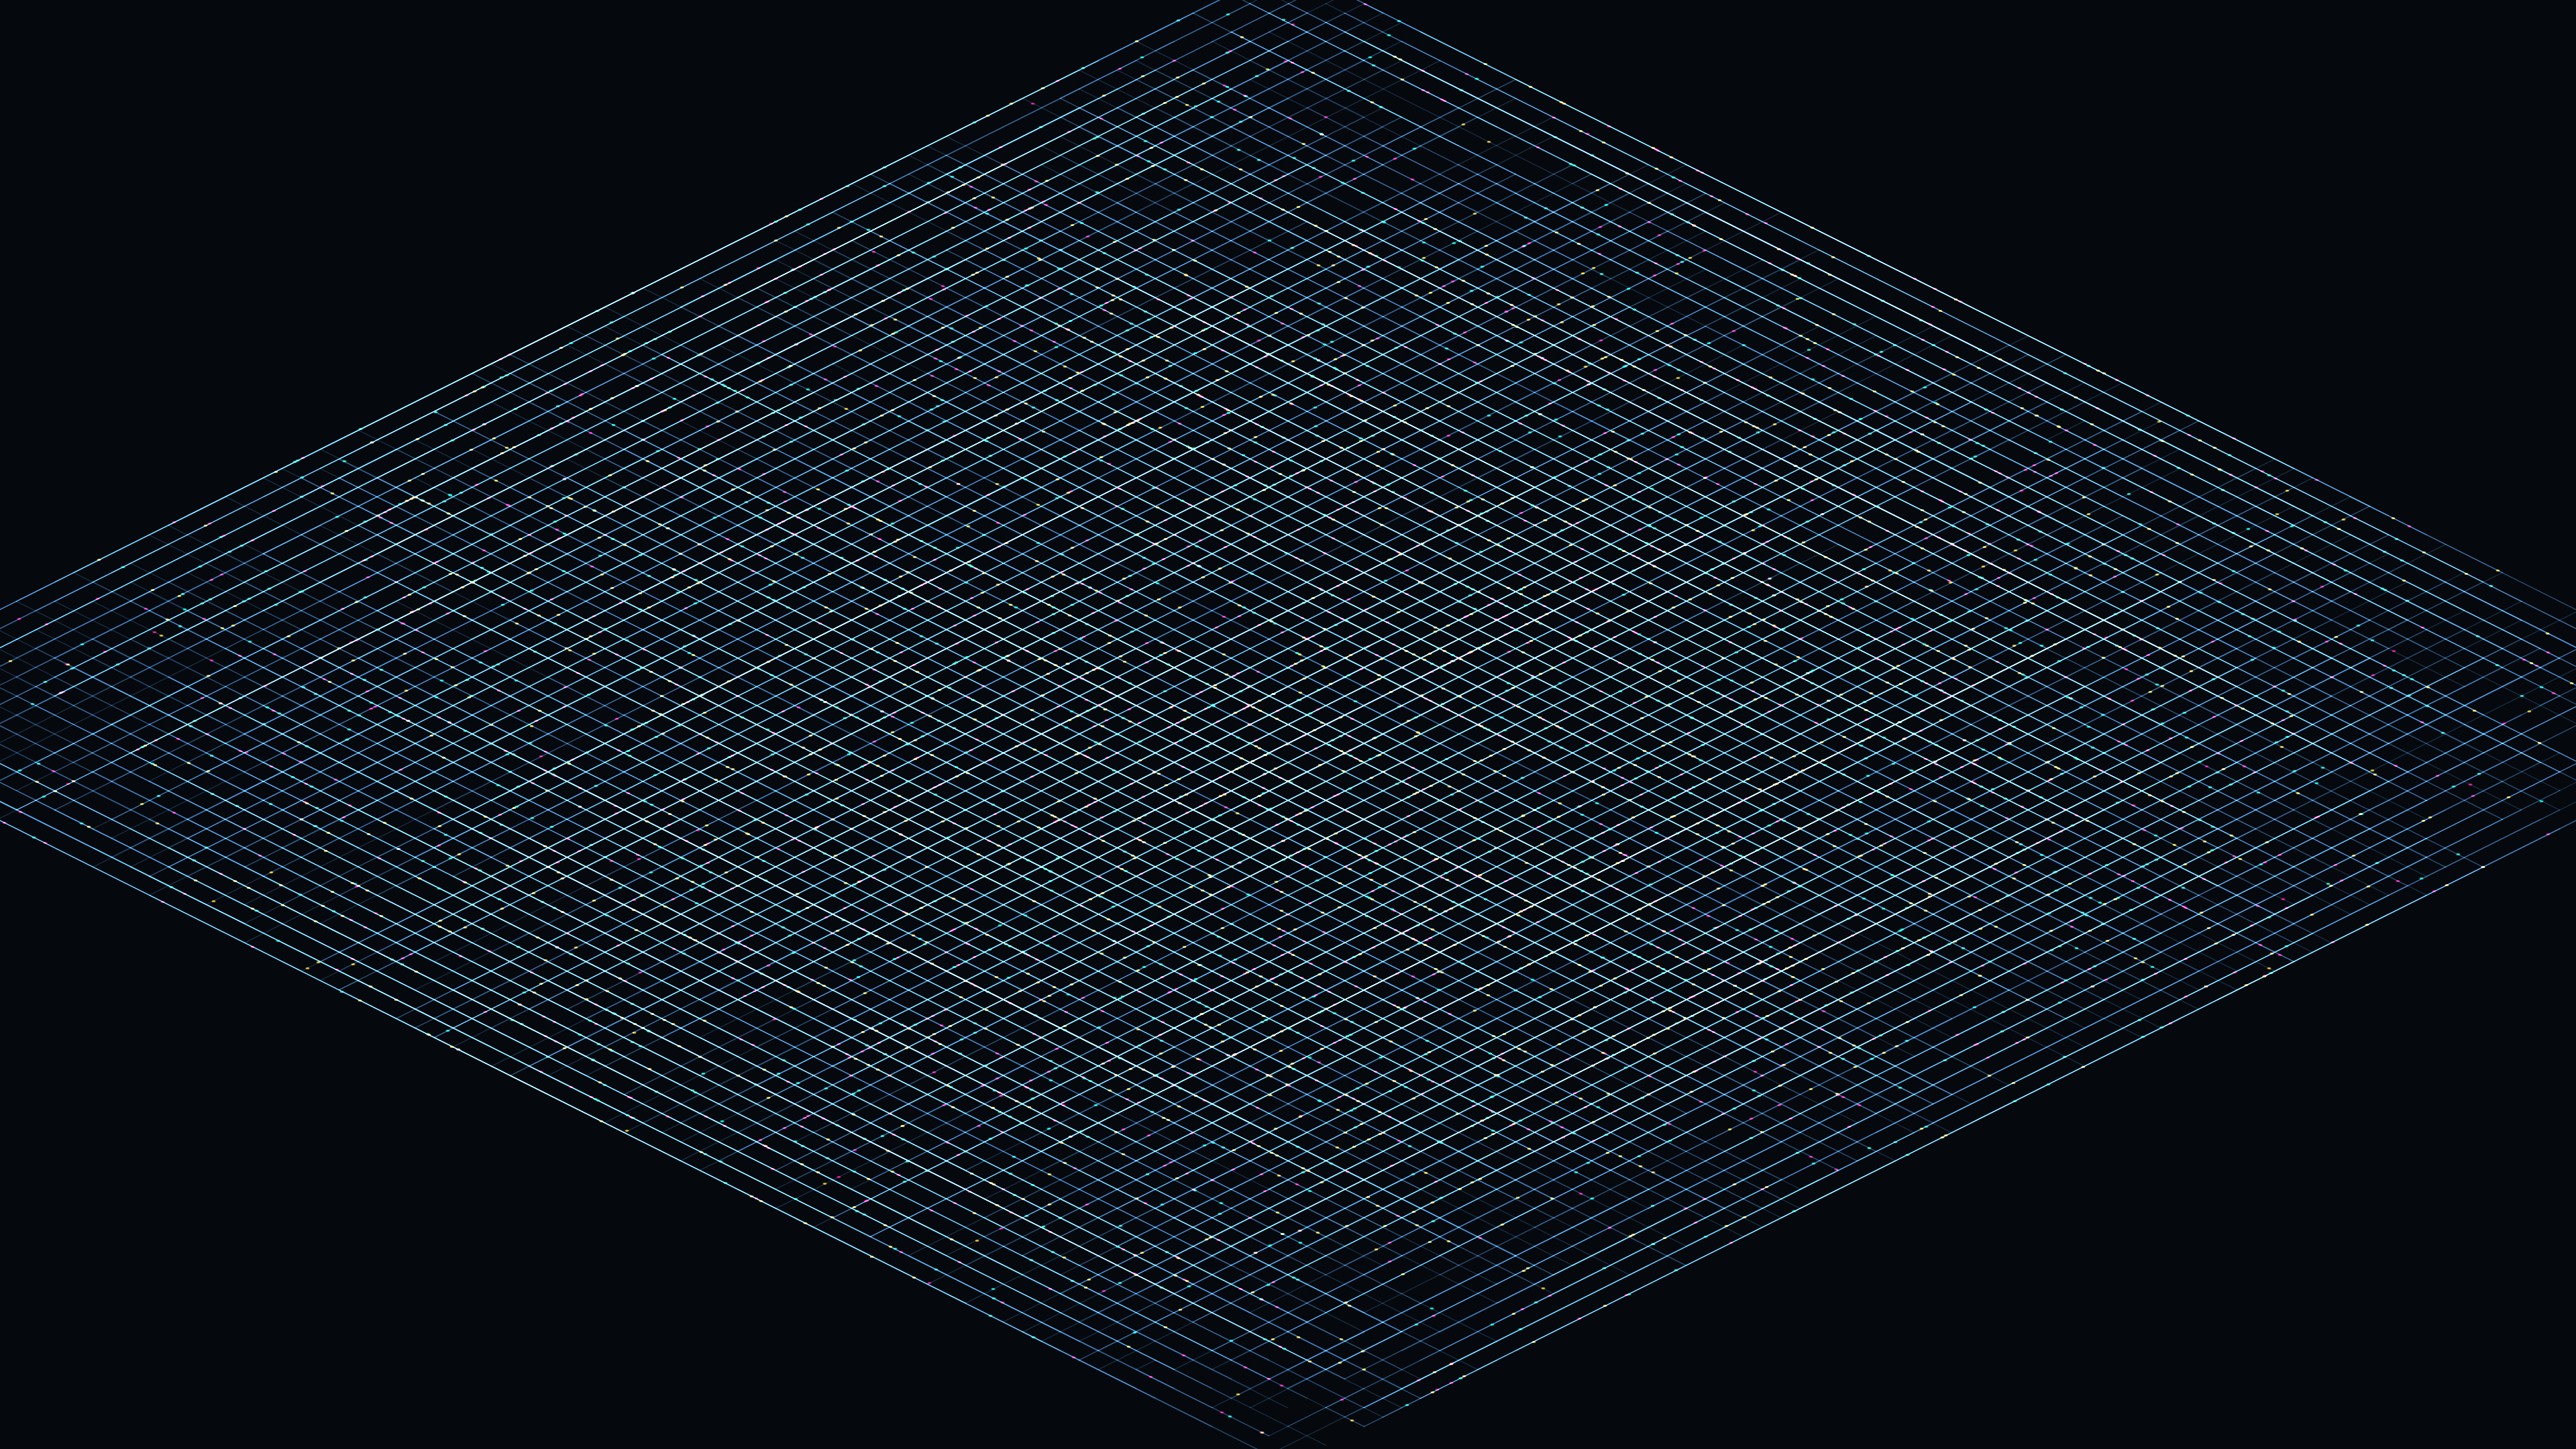
Visualizing the invisible flow of digital data is a classic trope of cyberpunk aesthetics. Often, these visualizations rely on complex 3D engines to render glowing motherboard traces and racing packets of light. However, with some clever math and 2D matrix transformations, we can create incredibly convincing isometric data architectures using just Python and py5. This article breaks down the technical execution behind "generative_isometric_cyber_circuit_board_2d."In this artwork, an isometric view reveals a massive, futuristic motherboard where 5,000 neon data packets race along 1,500 complex orthogonal traces. It is a dense, highly kinetic visualization of digital infrastructure. By stripping away true 3D modeling and relying solely on 2D vectors and affine transformations, the simulation remains highly performant and easy to prototype.
Visual & Aesthetic Approach
The aesthetic goal of this piece is to emulate a sprawling cybernetic cityscape or a macro-view of a microchip. The background is a deep, immersive navy blue (10, 15, 20 RGB), providing high contrast for the glowing data.The physical infrastructure of the board is drawn using faint, dark cyan lines, ensuring the underlying grid doesn't overpower the motion. The actual data packets are rendered as thick, glowing points using additive blending (py5.blend_mode(py5.ADD)). By using a strict CMY palette (Cyan, Magenta, Yellow) for the packets, the intersecting data trails naturally combine into bright whites and intense secondary colors when they cross paths, reinforcing the energetic, technological mood.To give the piece scale and depth, the entire 2D drawing is projected into a pseudo-3D isometric perspective. A subtle, continuously oscillating rotation is applied to this projection, making the massive circuit board "wobble" dynamically, creating a striking sense of parallax without any actual z-depth.Code & Technical Breakdown
There are three major technical challenges in this sketch: generating the orthogonal paths, animating thousands of packets along those paths, and applying the isometric projection.Generating Orthogonal Paths
To simulate traces on a circuit board, lines cannot simply be drawn from point A to point B diagonally; they must travel along a strict Manhattan (orthogonal) grid.# Generate random paths on a grid
num_paths = 1500
paths = []
for _ in range(num_paths):
x1 = np.random.randint(-GRID_SIZE//2, GRID_SIZE//2) * CELL_SIZE
y1 = np.random.randint(-GRID_SIZE//2, GRID_SIZE//2) * CELL_SIZE
x2 = np.random.randint(-GRID_SIZE//2, GRID_SIZE//2) * CELL_SIZE
y2 = np.random.randint(-GRID_SIZE//2, GRID_SIZE//2) * CELL_SIZE
# Orthogonal paths: (x1, y1) -> (x2, y1) -> (x2, y2)
paths.append(((x1, y1), (x2, y1), (x2, y2)))By forcing the path to break into two segments—first traveling horizontally, then vertically—we instantly achieve the rigid, organized look of a printed circuit board.
Animating the Data Packets
Managing 5,000 data packets means we need an efficient way to calculate their exact (x, y) coordinates at any given frame based on their speed and path. We do this by calculating the total length of the path and determining which segment the packet is currently traversing.# Calculate lengths of the two orthogonal segments
len1 = abs(x2 - x1)
len2 = abs(y2 - y1_2)
total_len = len1 + len2
# Current position (wrapping around 0-1)
progress = (packet["offset"] + t * packet["speed"] * 10) % 1.0
dist = progress * total_len
if dist < len1:
# Traveling on the first horizontal segment
ratio = dist / len1 if len1 > 0 else 0
cx = x1 + (x2 - x1) * ratio
cy = y1
else:
# Traveling on the second vertical segment
dist -= len1
ratio = dist / len2 if len2 > 0 else 0
cx = x2
cy = y1_2 + (y2 - y1_2) * ratioThis ratio-based interpolation allows packets of varying speeds and starting offsets to smoothly navigate the sharp 90-degree corners of the traces.
The Isometric Matrix Trick
Perhaps the most powerful technique in the sketch is how the 3D isometric view is achieved entirely through py5's 2D coordinate matrix.py5.push_matrix()
py5.translate(py5.width / 2, py5.height / 2)
# Slowly rotating isometric view
py5.scale(1, 0.5)
py5.rotate(py5.PI / 4 + np.sin(t * py5.TWO_PI) * 0.1)By simply rotating the canvas 45 degrees (py5.PI / 4) and then scaling the Y-axis by exactly half (0.5), any 2D top-down grid is instantly transformed into a perfect isometric projection. By adding a tiny sine wave to the rotation, the entire board gracefully spins and tilts over time.